page-header

Warehouse Identity

  • Mind mapping
  • On-Location Research
  • Interviews
  • Photography
  • Wayfinding
  • Digital Signage
  • Identity
  • Community Engagement
  • Prototyping
  • 3D modelling
  • Mind Node
  • Adobe Photoshop
  • Adobe Illustrator
  • Adobe AfterEffects
  • Fusion 360
  • Keyshot

Design Task

The Warehouse district is an area of Raleigh that has repurposed factories and old buildings to be turned into a hub of culture, design, food, and residents for Downtown Raleigh. Some of the more notable locations are CAM Raleigh, Citrix, HQ, Pit Barbeque, and Videri. The task was to use a form of identity that would brand the Warehouse district without slapping a logomark on it, but more of a way to create an experience identity that would speak more to the life of the location.

Design Process

The process began with doing research about the district. As a class we explored the district, including taking tours of various locations, interviewing business owners, and wandering about. The reason for this was to get a feel of what the district was really about and what each of the locations really shared. This ended up with us creating mind maps of different aspects of the district. Me and three others were mapping out the Repurpose aspects of the area.

The idea of Repurpose gave me ideas for how the integration of ideas could be used to push my design forward. I began with thinking about how Warehouse as a community and other communities could be integrated together. This lead me to think about how the various communities within the district really need each other to continue on being productive. This was presence while being there during a lunch time, you could see people from Citrix going to 5-Star Chinese Restaurant. When businesses move in, some of their employees will move into the local apartments to be close to work. When one business has a special item, another may use that in their own products, like how Crankarm Brewery will use Videri chocolate in a winter-seasonal beer. This integration and intertwining of ideas and goods became the overarching concept of my identity.

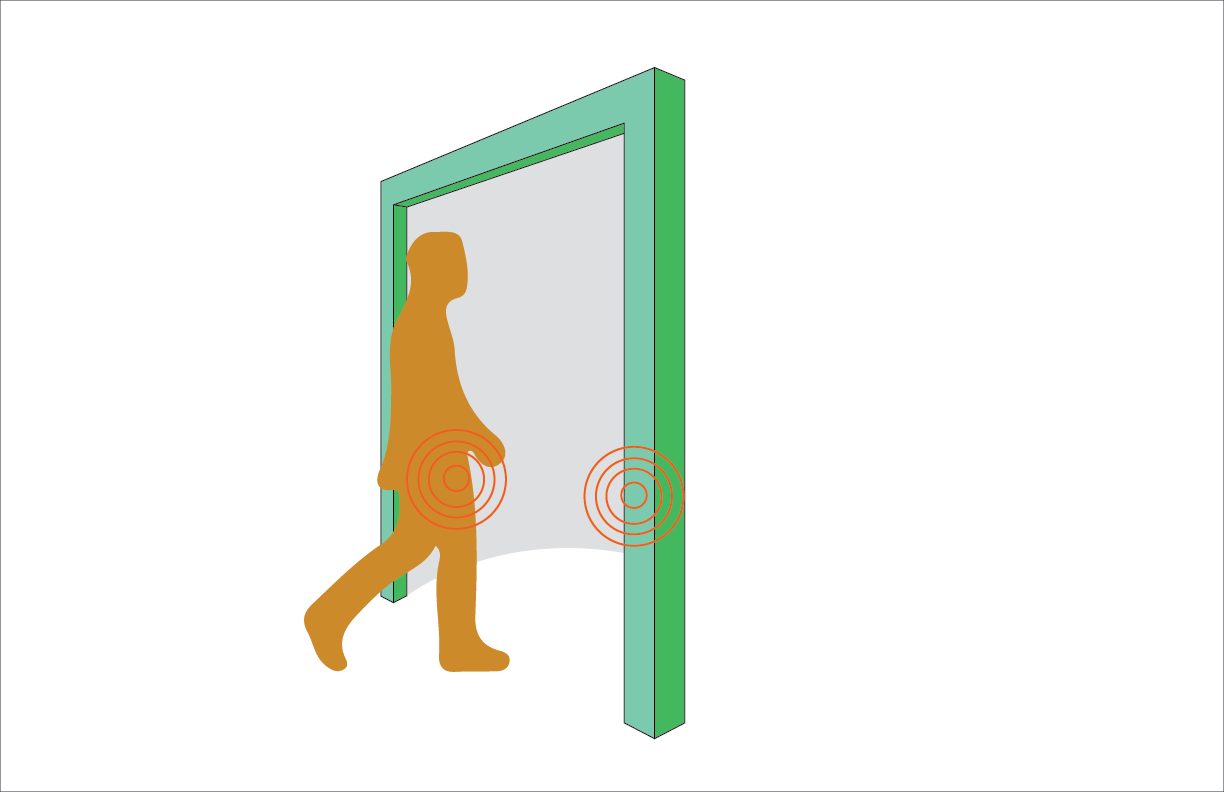
I thought of an artifact that anyone belonging to the Warehouse district could get and keep on them like attached to their keys, in their purse or pocket, etc. That would be embedded with an RFID. Then whenever someone from another business or residents would enter a location they are not tagged to a thread in the visualization would start to jitter. As more people from one business would collect, the jitter will be come greater and greater. This is a mixture of artifact design and data visualization. I explain more in the section below.

Business in the Warehouse District
Photos collected from Google
Artifact Iteration
  • Initial Sketches

    Initial Sketches

  • Initial Clay Models

    Initial Clay protoypes

  • Initial 3D model

    Initial 3D model

  • Model iteration 2

    Model Iteration 2

  • Model iteration 3

    Model Iteration 3

  • Final Model Iteration

    Final Model

Data Display Iteration
  • Initial Visualization

  • Iteration

  • Final Visualization

Warehouse Identity

The goal of my exploration was to encourage the members of the Warehouse District to interact more, and to honor the ones who are already interacting with other businesses and locations within the area. The concept would be implemented through an Radio-Frequency Identification , RFID, enabled device that when the device on a person would walk through the door way of a location it would relay that interaction on the displays hung in a central area of the district in real-time. While that person stays within the location, the thread in the visualization would jitter. As more and more people entered that location the jitter would become so great it would lead to very dramatic oscillations and eventually to it growing warmer and warmer in color. While I know privacy is a big part of people’s worries, the tag would only state which membership the owner was apart of. For example, everyone who worked with Citrix would have almost identical RFIDs – programming speaking. In instances that people belong to multiple locations, it would show up on both threads.

The thread like display is a data visualization matrix. There would be a total of 5 displays. The left side of each display is a different category of places in the district: Art, Business, Eat/Drink, Nightlife, or Retail. The left side depicts the locations in which are doing the interaction. The right side represents where the interaction is taking place. For example, if someone from Videri Chocolate went into HQ for one of their lecture series, on the Eat/Drink display, the line from the left side’s Videri node to the right side HQ node would jitter.

This central display would give people an indicator of what was going on in the district at any given moment and how intertwined the area really is. During the day, they could see how important the local condos are, or how people like to go out to eat, or drink in the evenings. This data could then be used as a way of finding ways to give encouragements to businesses that aren’t participating as much or rewards to ones that do.

What happens next…

While this was my first step, I believe the data visualization needs more refinement. I would like to prototype the interaction so I could show what a display would look like if many connections were going off. Until recently this level of prototyping was out my skill level. I also forgot to include the members of residential areas within the district during the formal presentation of this project. Based off my conversation after my presentation, the district seemed interested in this form of visualization, so in an effort to make this possible, further prototypes would need to be created as a proof of concept. I would like to propose this idea to the members of the district in a more formal sense. Given the level of connectiveness most people are today with the internet, I don’t believe the implementation would be difficult or expensive.

Membership Artifcat
Give scale to the artifact
  • Final Model

    Final Model

  • Hand For Scale

    Hand for scale

  • Keys for scale

    Keys for Scale

  • RFID Interaction

    RFID Interaction

Visualization of Warehouse district member interaction
The left side is doing the interaction and the right side is where
  • Art

  • Retail

  • Business

  • Nightlife

  • Eat/Drink

  • Business Matrix

Data Visualization Display
As attached to the formal Dillon Factory
Data Visualization Interaction
An example of what some simple interactions could look like
A turnable render of my artifact
Use your mouse or finger on touch-sensitive display to rotate around it.